Info Cells
Info Cells are transparent graphical and text items that overlay the map. Any drag actions on the map pass through the info cells as if they are not there.
They display real time data as noted below and they are refreshed every 2 sec if the data has changed and the data is written to the Statistics Database every 10 seconds with a timestamp. Because of limited display area, only 6 info cells can be displayed on an iPhone and 12 on an iPad or iPad mini. You can select which info cells are displayed and where on the screen using the KayakNav Menu Bar. The displayed items will be remembered each time you run KayakNav until you change the settings.
All values are automatically scaled for readability in the [Units] that you have configured. Behind the scenes, all data is collected and calculated in metric, but translated to metric, imperial or maritime units for display. The correct scaling factor is also used for best readability. For example:
- instead of showing 4.9999667 km, KayakNav will show this as 4.9 km.
- instead of showing 0.0901234 km, KayakNav will show this as 90 m.
- instead of showing 01:01:02 12 Jan 2017, KayakNav will show this as 1:01 am tomorrow or 1:01 am (today) or 1:01 yesterday as appropriate.
- instead of showing 123456 bytes it shows 12.3 MB.
Graphical info cells automatically scale and adjust their offsets for best resolution and may contain multiple colour-coded graphs and corresponding text.
Progress Totals
This group of Info Cells provides real-time information relating to the overall progress from the start, the expected progress to the Finish Line. It also provides information relating to tidal flows along the Route.
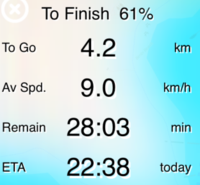
- Total % - reports remainder for the loaded route including % remaining to finish, distance remaining, average speed, time remaining and Estimated Time of Arrival (date/time ETA).
- Done % - reports the current progress for the loaded route including % distance covered from the start, average speed, time completed and the date/time that the start line was crossed.
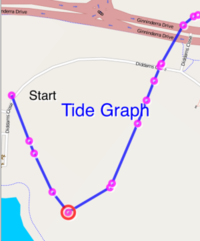
- Tide Graph - a graph showing the calculated relative tide height from the start (left) to the finish (right) along the route.
- Minor Waypoints are marked with a red dot.
- Major waypoints are labelled
- The current location is circled.
- Use this graph to determine the current tidal flows and changes in order to plan your breaks. In this example the paddler is currently at the low tide and it is about to start rising again as you travel towards the finish, so expect to be travelling against the tidal flow.
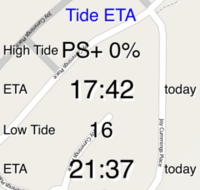
- Tide ETA - reports the location and date/time (i.e. WPA at 16:48) that you should encounter the next high and low tides. This helps to anticipate tide reversals and time your rest stops.
- High Tide PS+0 indicates that it is currently high tide as a point offset by 0% from the PS (Pre-Start) waypoint.
- ETA 17:42 Today indicates the estimated time that you will encounter high tide at your current speed.
- Low Tide 16 indicates the next low tide is at waypoint 16.
- ETA 21:37 Today indicates the estimated time that you will encounter low tide at your current speed.
Progress Next
These Info Cells provide real-time information relating to the progress from the previous Waypoint and the expected progress to the next Waypoint.
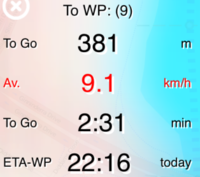
- To WP - reports remainder to reach the next way point including distance remaining, average speed, time remaining and Estimated Time of Arrival (date/time ETA).

- You can see the additional information provided by this info panel in the screen print at the right. I can be useful if you need to see your current speed and ETA to the next waypoint, especially if the next waypoint is the finish. Also note the tide graph for this 56km paddle on a tidal river.
- From WP - reports the progress from the last way point including distance covered, average speed, time completed and the date/time that the previous way point was passed.
Time Trial
These Info Cells provide real-time information aimed at time trials where you need to know your current progress and/or your estimated completion time based on progress so far.
- Current - reports the start date/time, current speed and bearing.
- Forecast- reports the forecast finish date/time, remaining time and time to finish along with the ETA. These forecasts are based on your average speed on the route.
Lat/Lon Bearing
This Info Cell provides real-time information about your current location according to the GPS or an estimate if the signal is lost for any reason.
- Location - the current latitude, longitude and bearing reported by the GPS.
Heart
If you have a heart rate monitor attached, this Info Cell can be used to show this information graphically.
- HR - a left-shifting graph of Heart Rate in beats per minute from the attached bluetooth heart rate monitor. It also shows the details of the connected device. This Info cell shows the current heart rate and a graph of the last 30 sec of rates. It also shows "Unsupported" because there is no device attached in this example.
Targeting
This Info Cell provides a window into the Navigation system.
- Targeting - shows details of the targetted turn point (pointed to by the torch) including the distance and bearing to this point. It also reports how far away you are from the optimal path on the route.
Current
This Info Cell shows calculated information from the accelerometer and the Navigation logic.
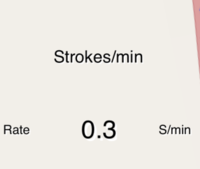
- Strokes/Min - average Stroke Rate per minute as determined by data from the accelerometer and the auto-correlation logic that detects strokes.
- Activity - paddling, resting, portage, driving etc. This is determined by a combination of the colour of the map under the paddler and the speed. KayakNav needs to be aware of the current Activity so that it can present the correct Animated Paddler Icon and handle Start Line and Finish Line processing.
Virtual Training Partner
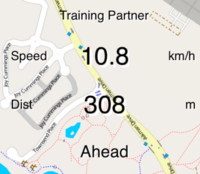
- Dist TP - reports the Virtual Training Partner speed, distance from your location and an ahead/behind indicator.
Map
- Zoom Level - the current zoom level and the type of zoom such as "Target WP", meaning we are zoomed to best show the next way point.
- Total Tiles - the number stored in the database and if you are loading tiles into the cache, the total downloaded. These figures are updated periodically. Stored, Requested, Downloaded.
Power
- CPU Usage - CPU used by KayakNav and approximate memory footprint. It is mainly used for debugging. See Power Conservation for more details of special battery saving features of KayakNav.
- CPU 1.5% indicates that the amount of processing power used by KayakNav is currently 1.5%. Note that it can go as high as 400% for 4 core devices.
- RAM 196 MB indicates the current memory footprint of KayakNav. This figure does not include the map or statistics databases.
Please note that Acacia reserve the right to alter the list of Info Cells available in new versions of KayakNav. Please email us if you would like to see any changes
