KayakNav Tide Calculations

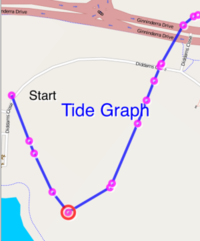
KayakNav can calculate the gravitational forces at any point on the earth at any date/time. When you drag the "Tide Graph" info-panel onto the screen, an X-Y plot of calculated tide levels is displayed for the entire course that you have selected.
The purpose of this graphic is to help you understand the relative changes in tide as you navigate a course. From the graphic, you can see the expected time and location that you will experience the next high and low tides based on your average speed. It can be useful to know when the tide is against you so that you can time your breaks and take advantage of the tide when it is with you.
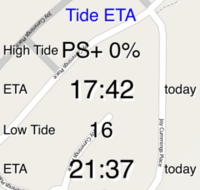
You can also drag the "Tide ETA" info-panel onto the screen to show the expected point and ETA on the course where you will encounter the next high and low tide points. "The "High/Low Tide" value indicates the first location on the course where you will reach that tide change. It is shown as "W+30%" which is made up of the first character of land-mark name (i.e. Wisemans) and the percentage distance to the following land mark. In this way, you know that you need to paddle past "W" by 30% before you will reach the tide change.
The calculated tide high/low ETA and position will be automatically logged with the other data like lat/lon, even if you do not display the tide info-panel.
The calculation of tides is fairly processor intensive but does not have to be done often. KayakNav automatically re-calculates the tide plot and position every 2 minutes and when you pass any flagged mark (with a label) on the route. This is why you won't see the tide plot appear until after you cross the start line.
In order to show the expected tide levels along the entire course, an ETA is re-calculated for each mark based on your average speed since the start. The X-Y plot is based on the horizontal axis being the paddle distance along the route from the start, and the vertical axis being the calculated relative tide height for the entire course. The calculations are processed using an auto-correlation function and projected onto a perfect sine wave and a known tide period of 12 hours 25 min.

The shape of the line displayed for the same course will vary depending on the date/time, so it will probably be different every time you look at it for the same course. This is the expected behaviour and is due to the movement of the moon and sun relative to your location on the earth.
The red circle shows where the paddler is on the course and the calculated relative tide at that point. Depending on whether you are faster or slower than predicted, the red circle may not follow the line exactly. You will see the line move around as you pass marks, and tide levels are locked in, and the remainder of the course is re-calculated. This marker only appears after your cross the start line.
It should be noted that it is almost impossible to accurately calculate the tide height and tidal flow speeds. Many factors influence tide levels and water speed:
- Water Depth - flow reduces to zero near banks of rivers and along coast lines.
- Channel Constrictions - narrower sections mean that the volume of moving water must travel faster than wider sections.
- Location Within the Channel - the centre of the channel will flow faster than near the banks.
- Islands - obstruct the flow of tides and concentrate currents.
- Underwater Topography - produce frictional effects that alter the flow of water.
Learn more here